
June and 2Q25 CPI Inflation Update: Tariff Impacts May Be Emerging
- CitizenAnalyst

- Jul 16, 2025
- 10 min read
First, a quick editorial note. I had planned on moving our inflation updates to once a quarter to reduce monthly noise and unnecessary repetition, but given the volatility associated with the new Administration's trade (i.e. tariff) policies, that was probably a fool's errand. We'll perhaps revisit that approach again at a later date. Given the "on again, off again" whipsaw around trade policy will likely continue, and given the Federal Reserve is ultimately going to formulate monetary policy based on what the data actually says, monthly updates will resume. Thus, while trying to wrangle this never-ending fluidity may perhaps seem foolish, this is all the central bank can do too. There may be times then when tariffs (or threats of tariffs) are scaled back, and we can be hopeful that any inflation that we currently see in the data might settle back down in coming months. Or, the opposite might transpire (which is perhaps what we're dealing with right now), where inflation fears are greater in the future than the data indicates today simply because the Administration is threatening to increase tariffs in coming months instead. It seems like we're just going to have to fly by the seat of our pants. At least for the time being, this is our new reality.
What we'll do today then is to show charts through the month of June, which include Tuesday's June CPI report. We'll cut the data in some new ways this month to try and identify whether or not tariffs are starting to show up in the numbers or not too. The crux of today's post is that June's inflation report definitely has some concerning aspects to it, but the report in total was not so outstandingly bad that all of the narratives about the market and the economy on Monday ought to be thrown out the window today. That being said, June's problem areas were problem enough to notably raise the significance of July and August's CPI reports. The question for coming months will be whether what we saw in June continues, or perhaps worsens, later this summer or not.
A secondary but perhaps even more important question is if July and August's inflation reports do show similar or worsening trends, how do they affect the odds of the Administration attempting to fire Chair Powell? It seems like bad reports will lead to greater chances the Administration attempts to fire Powell, regardless of the merits or legality. That will be a whole other mess, but we'll hopefully not have to write (or worry) about that.
Let's now to turn to the data. June CPI rose 0.3% month-over-month, seasonally adjusted, while core CPI (which excludes food and energy) rose 0.2% (+23 bps unrounded by my estimate). This was slightly softer than expected in the core, which was good, but as we'll discuss more in a minute, how we got there was a little more concerning. Lastly, these month-over-month figures put the year-over-year figures at 2.7% for headline CPI (up from 2.4% in May), and 2.9% for core (up from 2.8% in May, April and March). Below is a table showing the last 12 months of data and key aspects of it.

Let's now look at June's report through our 3 buckets, and we'll try and sprinkle in commentary about April and May as well when appropriate. We're actually going to go in reverse order today though: we'll tackle shelter first, and then core services ex. shelter, and lastly, goods. I'll explain why in a minute.
June's CPI Shelter component contributed +9 bps to our +23 total core figure, which was it's lowest (best) reading since March (when shelter also contributed +9 bps). Prior to March's reading, it wasn't since September of '24 that Shelter made this low of a contribution to the core CPI. While September of '24 and March of '25's +9 bps contributions were followed by several months of re-acceleration in CPI's Shelter index, let's hope the fact that we've got two good readings here in a span of four months indicates that the CPI is finally following private market data (where multiple sources have indicated rents have been declining for two years now, see here, and here) lower. As we always say in these posts, however, don't hold your breath on this one. We did, after all, see two +9 prints from CPI Shelter within a span of four months last year too (June and then September, as noted above), only to see a re-acceleration afterwards.

Now let's turn to core services ex. shelter. As you can see in the chart below, after being very quiet over the last few months, core services had a fairly notable contribution to June's core CPI, with this month amounting to +10 bps. This was the highest since January's +22 bps, and September's +17 bps before that. Besides June of '25 and those other two months last year, core services has been behaving quite well, contributing at or below pre-COVID levels for the better part of a year. Unfortunately this month that reversed, and the culprit(s) was both concentrated and widespread at the same time. Medical Care Services was by far the biggest driver (+5 bps versus +2-4 in recent months), but almost every other category contributed at least +1 bp as well. Considering the three months prior to June showed total core services contributions of -2 bps, +3 bps, and +1 bps, this is a notable change, and one for the worse.
It's not clear exactly what's causing this, and we won't speculate much here except to highlight that the labor market, if anything, has weakened somewhat compared to the end of last year. Thus it seems unlikely that wages are a key source of cost pressure for services providers (wages are often a key input cost for services firms) given what other labor market data has been indicating (see here for the most recent BLS jobs report, and here for Paychex's Small Business Wage data). Some public companies have called out wage increases as a problem again this quarter (see J.B. Hunt, for example), but it's possible things like insurance and workers' comp (also called out by JBHT) are bigger driving factors here than workers' wages themselves.
Others have highlighted tighter immigration as a potential source of upward cost pressure for services providers, but this should in theory show up in broader labor market data, and as noted above, that isn't really happening yet. Unlike with goods, where tariffs can be used as an easy explanation for greater (and broader) inflation, given the lack of an obvious comparable candidate for core services, this part of June's inflation report was arguably the most concerning. But given what's been happening in recent months, it's probably wise to not overreact to this part of the data quite yet.

Let's now lastly turn to goods, which in contrast to '22 and '23 (when the focus was on core services ex. shelter), has been and likely will be the focus of CPI inflation reports for the foreseeable future. This month, goods contributed +4 bps to our overall +23 bps. As the chart below indicates, this +4 bps doesn't seem particularly egregious or frightening at first blush, but two key things ought to be highlighted here: first, household furnishings and supplies contributed +4 bps this month, which was its biggest contribution since February of '23; second, "Transportation Commodities Less Motor Oil", which is predominately made up of car prices (both used and new), contributed negative 4 bps this month. Recreation commodities (think sporting goods and the like) contributed +2 bps, itself the highest since January '24, and Apparel contributed +1 bps.
Given what's happened with Manheim's Used Car Price Index of late, it doesn't seem like these kinds of price declines for cars (either new or used) are going to continue. If anything, you could see positive 4 bps contributions in coming months instead of negative. Though to a certain extent we can always fear this hypothetical, had this happened in June, it would have created an +8 bps swing in this month's report and put the core reading at +31 bps instead of +23 bps. While these are seemingly not considerably different numbers, when you annualize them, one produces annualized inflation of 2.76%, and another produces annualized inflation of 3.72%, or almost a full percentage point higher. Considering the steel and aluminum tariffs as well as the 25% tariffs on autos and their components, we shouldn't be surprised at all if increases in this element of the goods CPI moves in an unfavorable direction in coming months, similar to what we saw with Apparel, Household Furnishings and Supplies, and Recreational Goods in June.

While the goods "bucket" this month seemed to indicate greater breadth across the category, let's spend some more time on this to see if we can confirm that beyond just the few items that we named above.
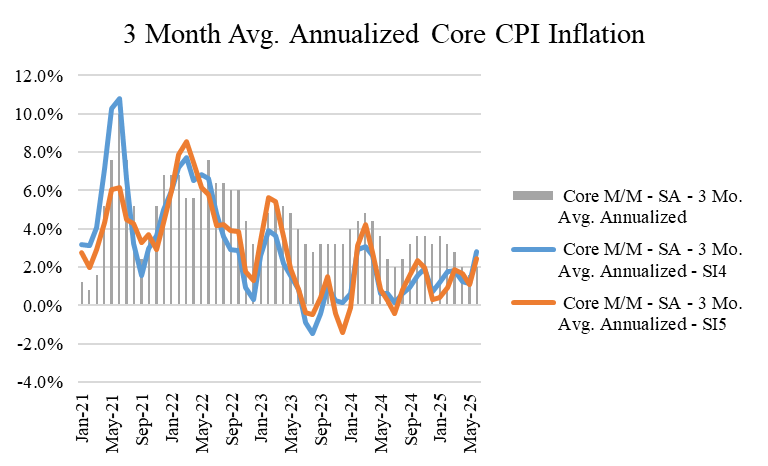
Normally we look at the median and average increases for Category Level 4 and Category Level 5 goods and services to assess inflationary breadth. The idea there is by looking at broader baskets of goods and services and looking at their median and average increases, we can see if more items are inflating at faster rates, or if it's fewer items with greater weights that are inflating more and driving the aggregate index instead.
As a reminder, Category 4 (denoted as SI4, or "Sub-Indent 4" in the charts below) includes 55 goods and services baskets that represent roughly 98% of the core CPI, while Category Level 5 (denoted as SI5 in the charts below) is a group of 101 goods and services baskets that comprise roughly 77% of the core CPI. These "indents" are from Table 2 of the CPI release each month, for reference. For what it's worth, this month, the average and median increases for Category 4 were 0.4% and 0.4%, and 0.3% and 0.44% for Category 5. These were the highest figures since late 2023 and early 2024.


And now here's the 3 month chart of these figures, annualized. This one unfortunately shows the lines (the 3 month averages of SI4 and SI5) moving back above the 2% line for the first time since last fall. Inflationary breadth appears to be moving in the wrong direction and the charts both above and below indicate that.
Let's take things a step further this month by looking at the median and average increases for just goods across the two sub-category levels we discussed above (Category Level 4 and Category Level 5). As the two charts below show, both the median and average increases for the goods baskets increased at the fastest rates in June since at least last October. At annualized rates, goods are inflating at 5% or worse. More importantly, the fact that both the medians and averages of our category level breakdowns are increasing so much also suggests that goods breadth in particular is increasing again. While we probably can't ever be absolutely sure, this is probably about as good an indication as we can get that tariffs (which have been implemented broadly) are responsible for driving consumer prices higher.


Let's do one more thing new this month. We can also look at inflationary breadth by looking at 200 individual line items in the core CPI. The chart below shows both the number of categories, and the percentage that number represents as a percentage of all core CPI line items, that are at 6 month high inflation rates each month. So for example, December of '24 saw 50 line items out of 200 that were inflating at their highest rates in 6 months (which equates to 25% of the total). January then saw 78, which represented 39%. As the chart also shows, June's figures were considerably higher than where they were in each of the last four months, and nearly eclipsed where these figures were in January (and as we've discussed in prior posts on January, whether it's because of "residual seasonality" or for other reasons, January CPI releases tend to show hotter inflation), which historically tends to be a month to ignore. This approach too points to accelerating inflationary breadth in June.

In summary, while the aggregate core CPI number this month was not that alarming at face value, there are definitely things underneath the surface that are concerning, particularly that core services seem to be inflating at faster rates again, and also that inflationary breadth appears to be accelerating again as well. This is a noticeable deviation from where we were even just a month ago and for most of this year, so it's wise to not overreact to just one month's worth of data. But it's clear that the middle of the month CPI releases are going to bear a lot greater significance again for at least the next several months.
There are other considerations to keep in mind too though. First, even if goods inflation picks up, it's not clear overall inflation will increase so much that inflation in aggregate can't continue to recede to the Fed's 2% inflation target. For example, using this month's +9 bps contribution for shelter, if core services reverts back to prior months' levels (which isn't a ridiculous assumption given what we noted earlier about the "ok" labor market), and contributions from that "bucket" move back to <5 bps, that leaves room for goods to contribute 8-10 bps a month (which would be well above the goods' category's historical average of 0) and core CPI monthly increases would still only be in the +20 - 22 bps range. Annualized, and adjusting for PCE differences versus the CPI (recall the Fed targets PCE inflation and not CPI), this would put us pretty darn close to 2%, and that's even with overstated shelter inflation as well.
Additionally, consumer spending has already started to slow for key categories like travel, so airline and hotel fares could continue to stagnate or even decline. That could represent tailwinds in coming months' CPI readings. Consumers could also recoil from goods more generally (especially cars) if retailers think they have more pricing power than they actually do. This could push prices right back down, and this time at the expense of retailer margins. Or, consumer spending could hold up, and retailers might feel emboldened enough to pass the higher costs through to customers. So far, based on what the country's largest banks have reported, this latter scenario feels increasingly likely.
Bottom line, it's tough to assess what "run-rate" inflation is these days, but it seems to be starting to rise again. We're probably still a lot closer to 2% than we think, especially marking shelter inflation to market. But that said, June's CPI report means our summer's fate is definitely a little more alarming now than it was a few days ago.


Comments