
Dec. CPI: How long...will this keep goin' on?
- CitizenAnalyst

- Jan 12, 2024
- 4 min read
December CPI came in at 0.3% month-over-month, seasonally adjusted, both on the headline (which includes food and energy prices) and core (which does not). This was above expectations of 0.2% in the core. The miss was driven by what else? Shelter. Headline CPI was up 3.4% year-over-year (up 0.1% from last month's figure), while core ticked down to 3.9% year-over-year from last month's 4.0%. We’re going to keep this month’s CPI post short and sweet, because 1) the same themes from prior months (especially in shelter) continue to recur, and 2) there was little in the way of notable new monthly callouts from categories away from shelter.
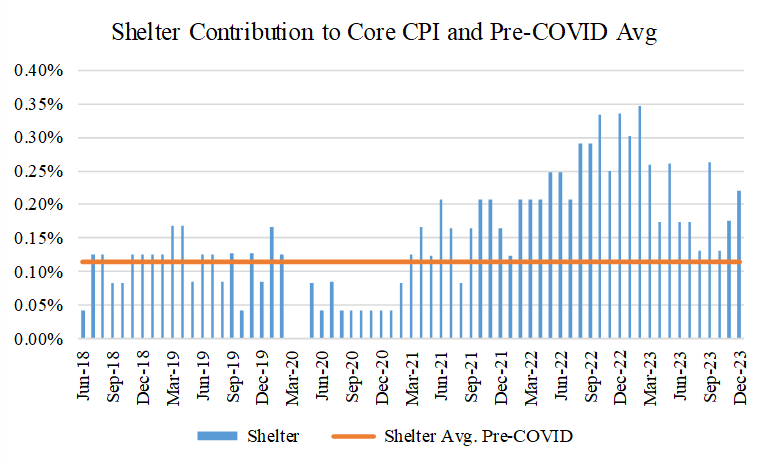
First, let’s get to the usual data suspects. This month’s core CPI increased by about 0.33% (unrounded). Goods contributed -1 bps this month (in-line with the pre-COVID average of essentially zero), services ex. Shelter contributed +12 bps (above the pre-COVID average of +7 bps), and shelter contributed +22 bps, more than double the pre-COVID average of +11 bps.


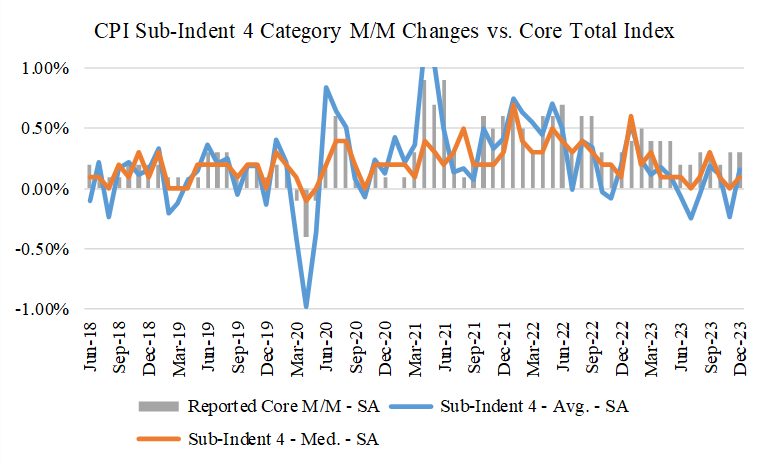
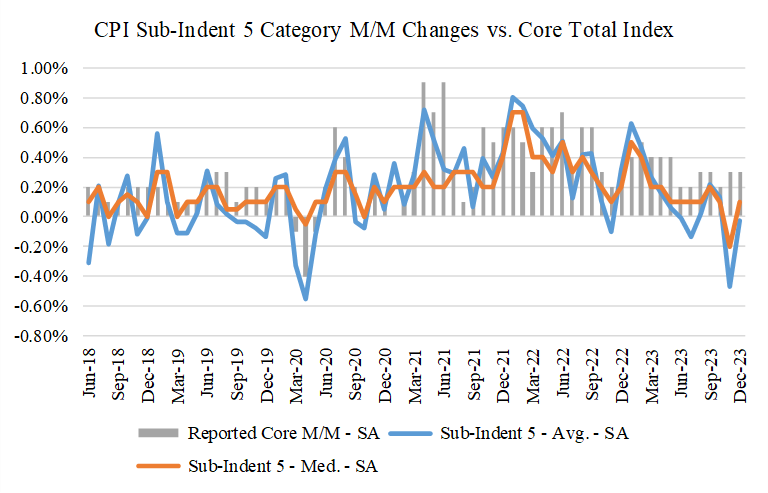
Let’s also insert a couple other charts showing category level inflation as well. This month, the relevant sub-category level data also again looked favorable, with average and median inflation figures for Sub-Indent 4 (our basket of 55 categories of goods and services that make up 98% of the core CPI) and Sub-Indent 5 (a basket of 101 categories that makes up 77%) increasing at rates of 0% to 0.15%. This kind of low inflationary breadth again instills confidence that inflation has come down considerably. Notice not only that the lines remain below the bars, but also that the lines themselves are at absolute levels in-line with where they were pre-COVID, if not below.
Coming back to the Shelter bugaboo, notably, shelter’s contribution of +22 bps was a big jump from last month’s +18 bps, which itself was a big jump from October’s +13 bps. Are shelter prices actually accelerating again though? Is it time for those of us who have been arguing the CPI shelter component will get better to finally wave the white flag and just admit we were wrong? The answer is no, though admittedly, at this point, it’s unclear why this hasn’t happened yet.
For perspective, this month’s CPI shelter and owners’ equivalent rent measures both increased by 0.5%, which produces annualized shelter inflation of about 6%. Below are several rent indicators that we’ve highlighted in prior posts that indicate that if anything, shelter prices continue to get better (or less inflationary, and actually de-flationary in some cases), not worse. So CPI’s shelter index shows accelerating inflation, and publicly available rent trackers are showing continuing to show deflation, as they have in recent months as well. Quite the conundrum.


We’ve discussed the mechanics of how the CPI’s shelter components work in prior posts, so I won’t go over them again today. At the risk of beating a dead horse, however, there’s really no reason to not continue to expect further compression in this part of the CPI. After all, it’s not like the Bureau of Labor Statistics (the government agency that collects the data for the CPI) is somehow getting their housing data from a completely different housing stock than Realtor.com, ApartmentList.com, CoStar, and all the others. Eventually, they have to converge, but I don’t blame you for getting a little fatigued with my saying this. They also have no perverse incentive to keep it high.
The question remains though: if CPI’s shelter component doesn’t correct, what will the Fed do? Several rate cuts were baked into the Fed’s most recent interest rate forecast, and this was almost undoubtedly due to the expectation that before too long, the Fed would be able to talk about 3 and 6 month annualized core CPI figures of 2-2.5%, which, after adjusting for methodology differences between the CPI and PCE (the latter of which is the Fed’s preferred inflation benchmark), would put us right where we’re supposed to be (at 2%). But if shelter takes another year to cooperate (god forbid), will the Fed still cut rates, even if market based rent indices continue to show housing inflation well below trend and very much compatible with overall 2% inflation? If I had to guess, I’d say there’s a 70% chance that the Fed will not cut rates in that scenario, with a 30% chance that they’ll ignore the misleading headlines and higher-than-reality reported core inflation figures. This feels like it’s brewing as a potentially important question that will deserve more conversation in future months. But hopefully, we won’t have to.
I’ll close with the figures and chart that we showed last month, showing where I think “true” inflation currently is in the economy today. The answer this month is really no different than last month, though if anything, market based rent measures give me more confidence that real inflation in the real economy is close to 2%. This month, adjusting for the shelter lag I estimate “run-rate” CPI inflation is about 2.35%. 3 month and 6 month averages are 2.25% and 2.41% respectively, still essentially at the Fed’s target.


Comments