
Oct CPI: Last Month We Took An "L" But Today We Bounced Back
- CitizenAnalyst

- Nov 14, 2023
- 6 min read
October headline CPI came in better than expected: flat month-over-month, with core CPI coming in at +0.2% (both seasonally adjusted). This was better than expectations of a +0.3% increase month-on-month for the core, and a nice bounce-back from last month's 0.3%. Year-over-year, headline CPI rose 3.2% (vs. 3.7% in September) while core CPI increased 4% year-over-year (the lowest rate since September 2021). As we'll show in a moment, the details are more positive and continue to suggest we're already likely to be much closer to our 2% inflation target than many think.
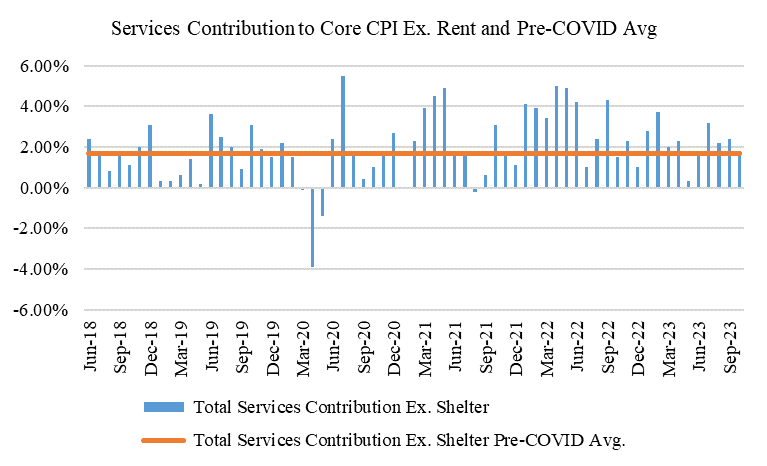
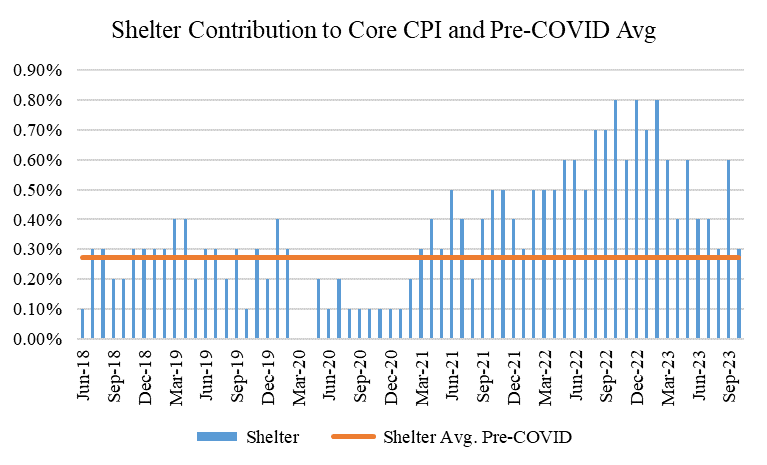
As a reminder, the Fed (the US's "Central Bank") has been looking at inflation in three "buckets": goods, services excluding shelter, and then shelter. For the month, goods contributed -3 bps, shelter contributed +13 bps, and services ex. shelter ("core services") contributed 10 bps, which sums to +20 bps (or 0.20% month-over-month unrounded). This compares to pre-COVID averages of 0 bps, +11 bps, and +10 bps for those three "buckets" respectively. This is all encouraging considering these were the levels we were running at when inflation was 2% prior to the pandemic. The snapback in shelter's contribution this month (see chart below) was particularly encouraging considering what's been happening with market based rent indices of late (which are indicating rents are flat at best, see here: https://www.realtor.com/research/september-2023-rent/ and here: https://www.apartmentlist.com/research/national-rent-data). As we explained recently (https://www.citizenanalyst.com/post/sept-cpi-a-bit-of-a-strange-month-but-on-balance-more-bad-news-than-good), CPI calculates shelter inflation in a way that produces a lag compared to market based indices, so while everyone has been expecting the shelter component to continue to recede, like everything else with COVID, it's taken longer to normalize than we thought.

If the buckets were generally in-line, what about the category level? As a reminder, we like to look at category level statistics to try and capture inflationary breadth. Because different categories have different weights in the CPI, movements in certain categories can sometimes create distortionary effects in the aggregate index. By looking at category level medians and averages, we can see broader inflationary trends across baskets of goods and services that the aggregate indexes (or even our big three "buckets") don't always show.
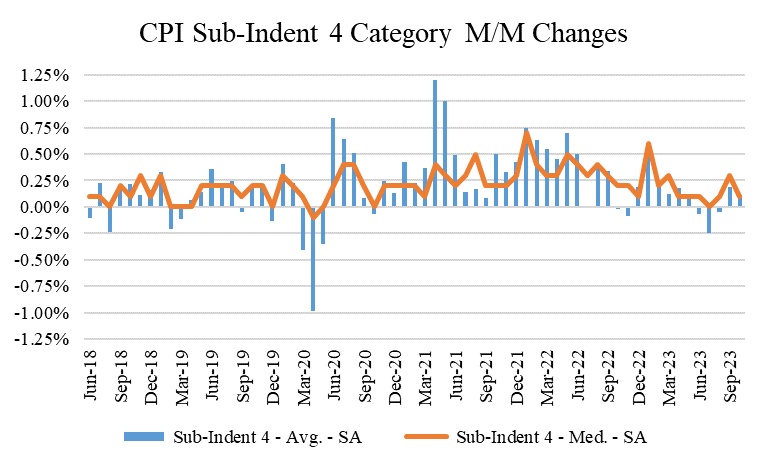
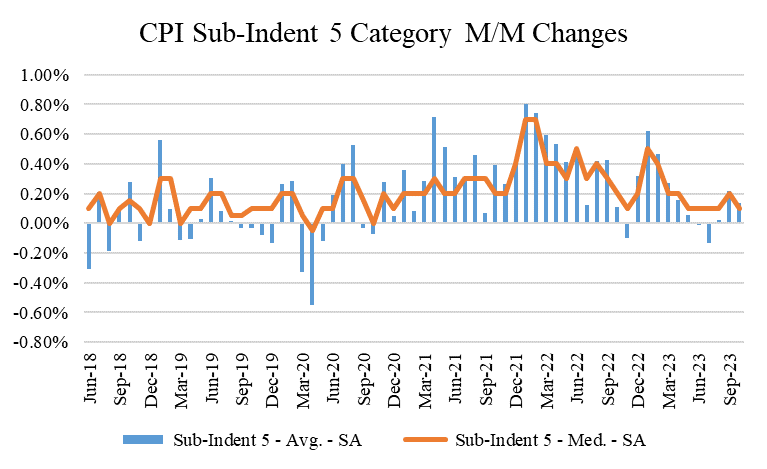
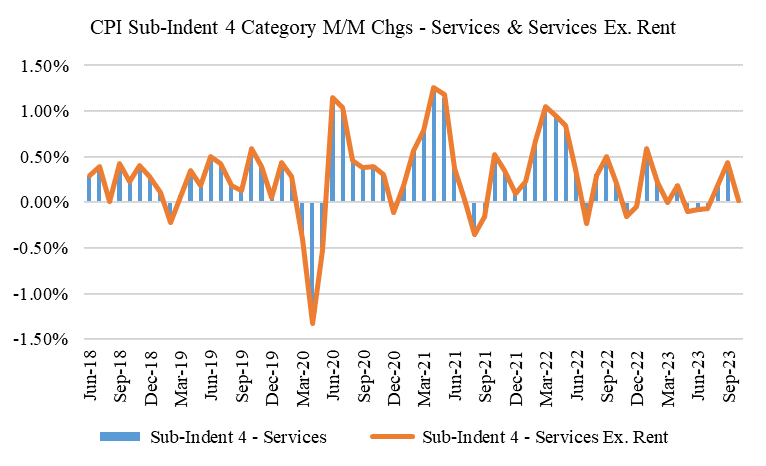
First, below are our charts for "Category Level 4" and "Category Level 5." These are baskets of goods and services that are essentially 4 and 5 layers deep into the CPI basket. Category 4 includes 55 baskets of goods and services that make up about 98% of the core CPI, while Category 5 is a basket of 101 goods and services, but which only make up about 77% of the core CPI. Consequently, if we had to pick, we should (and do) focus on Category Level 4 for the best category level insights. This month, both Category 4 and Category 5 saw average and median increases of about 0.1% month-over-month (and seasonally adjusted). Annualized, this produces inflation of about 1.2%, which is well within the Fed's 2% target. The charts of these figures show a reversion back to the trend we had seen for a while prior to last month's spike up, which is good, as it continues to indicate inflationary breadth is cooling back to normal levels.
Digging a bit deeper, however, we notice a few things. Interestingly enough, at the category level, goods was actually worse this month, and core services were better. Below are charts showing the median increases across goods categories both including and excluding cars, and then a similar chart for services (no impact from cars here). Notice the spikes in the opposite directions this month. Given choppier shopping patterns for consumers post COVID, the promotional cadence from retailers continues to bounce around (with Black Friday deals beginning earlier and earlier each year, you can expect this choppiness to continue in the future, most likely), so it's possible the odd volatility in goods this month is due to that, but we'll have to see. Regardless, the goods spike wasn't so bad that it is a cause for concern (especially considering what's been happening with consumer spending data, which has been far weaker than government figures suggest), but we'll have to see there too.

Second, while there are always monthly categories that one can point to that are bigger or lesser contributors, one category that we haven't spoken about before but that deserves our attention is car insurance. As you've probably noticed, your car insurance bills continue to go up. Many are probably saying "what else is new?" but the level of increases has been particularly high over the last year. Look at the following chart:

As you can see, before COVID, car insurance prices didn't go up much, simply because car price inflation historically has been relatively minimal as well. This resulted in costs to insure a car not going up much either.
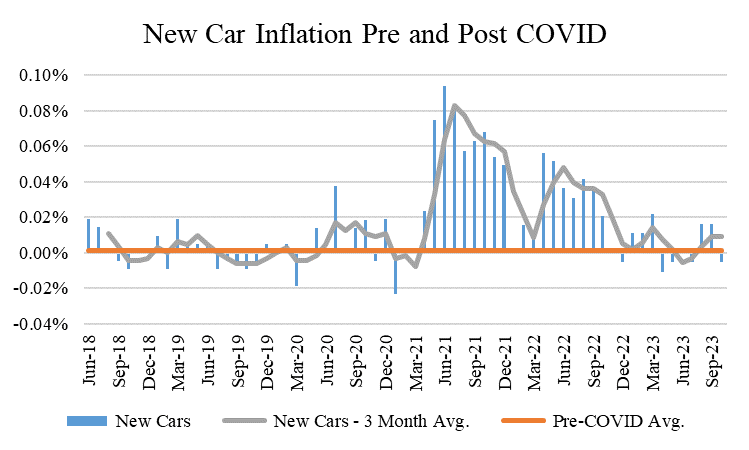
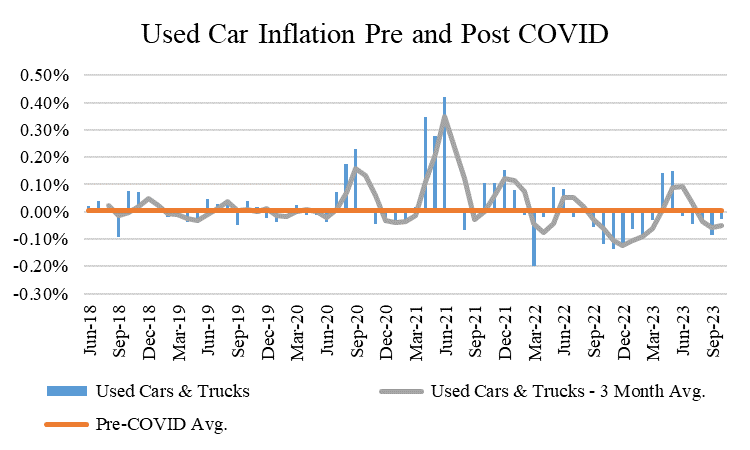
The auto insurance industry has not all of a sudden morphed into an amazing business with all this newfound pricing power, contrary to what this might make you think. Rather, what's happening is a lag effect of insurance companies catching up to the spike in car prices that we've seen since COVID. To be clear, many people often confuse "dis-inflation" with "de-flation." I happen to think this is why consumer surveys still seem to be continuing to show dismay over inflation, despite the progress we've been discussing for a while now. For consumers, we're annoyed that prices are still well above where they used to be in absolute terms. Sadly, it's unlikely most prices are going to actually come down to where they were pre-COVID, simply because costs (particularly labor costs) have indeed gone up too, and those are unlikely to reverse. Thus, while it's annoying to adjust to these new higher price levels (I copied a key the other day and it was $4 (!!) at Home Depot...couldn't believe it), what we ought to care more about from here is not the absolute level of prices (though that does certainly matter), but rather the level of increase in prices. This is what inflation really is. It's the rate of change. "Dis-inflation" then is lower inflation, or less of an increase (so a 2% increase instead of a 4%, for example). "De-flation" is where prices are actually falling (so say a 2% decline in prices). Let's hope we never have to deal with Dis-Deflation (slower price declines), which would be make us finance folks sound even worse than we already do, but we'll cross that bridge (and laugh) if we ever come to it.
We saw a large spike up in car prices after COVID, and while they've come down some (read: deflation), they're probably unlikely to keep coming down in a big way from here. What we'd like to see instead is smaller, more pre-COVID like increases (dis-inflation). That seems to be happening, thankfully.
As car prices have started to behave normally again, the car insurance industry's price increases are likely to normalize too. This will take some time (similar to the CPI's shelter component, it takes time for everyone to renew at these higher rates), but it does feel like it's "in the pipeline." Why does this matter? Because as the chart above showed, auto insurance's contribution has been 6-7 bps a month to our monthly core CPI number. To put this into more context, this month's +10 bps contribution from core services ex. rent was 70% driven by auto insurance. In a more "normal" time, this will be closer to 0. Thus, as this headwind evaporates in coming months, that makes it that much more likely we'll continue to see monthly inflation prints like we did this month. This isn't to say other categories can't get worse from here (healthcare has become a headwind again, for example, something we'll look at more closely in future posts), but since we should have pretty good visibility into car insurance trends (given their correlation to car prices), this one is worth calling out now.
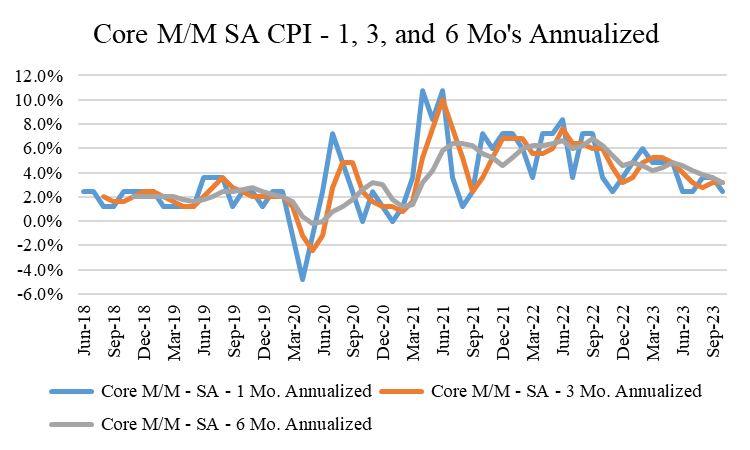
To summarize, monthly inflation readings, like anything else, rarely go up or down in a straight line, but as the chart below shows, the broader trend remains our friend. With consumer spending remaining more tepid than many realize, and wage growth normalizing in a cooling labor market, it feels more likely than not that this trend will continue in coming months. As businesses' cost burdens increase at more normal rates, their price hikes are likely to continue to normalize too. For what it's worth, markets seem to agree (usually markets are smarter than any one of us is as individuals). As of this morning, the futures markets are now pricing in no more rate hikes and a decent chance of the first Fed rate cut in March of '24. These forecasts have been headfakes before, so only time will tell, but for now, we'll appreciate having the trend be our friend, at least for a month.


Comments